Use your space efficiently
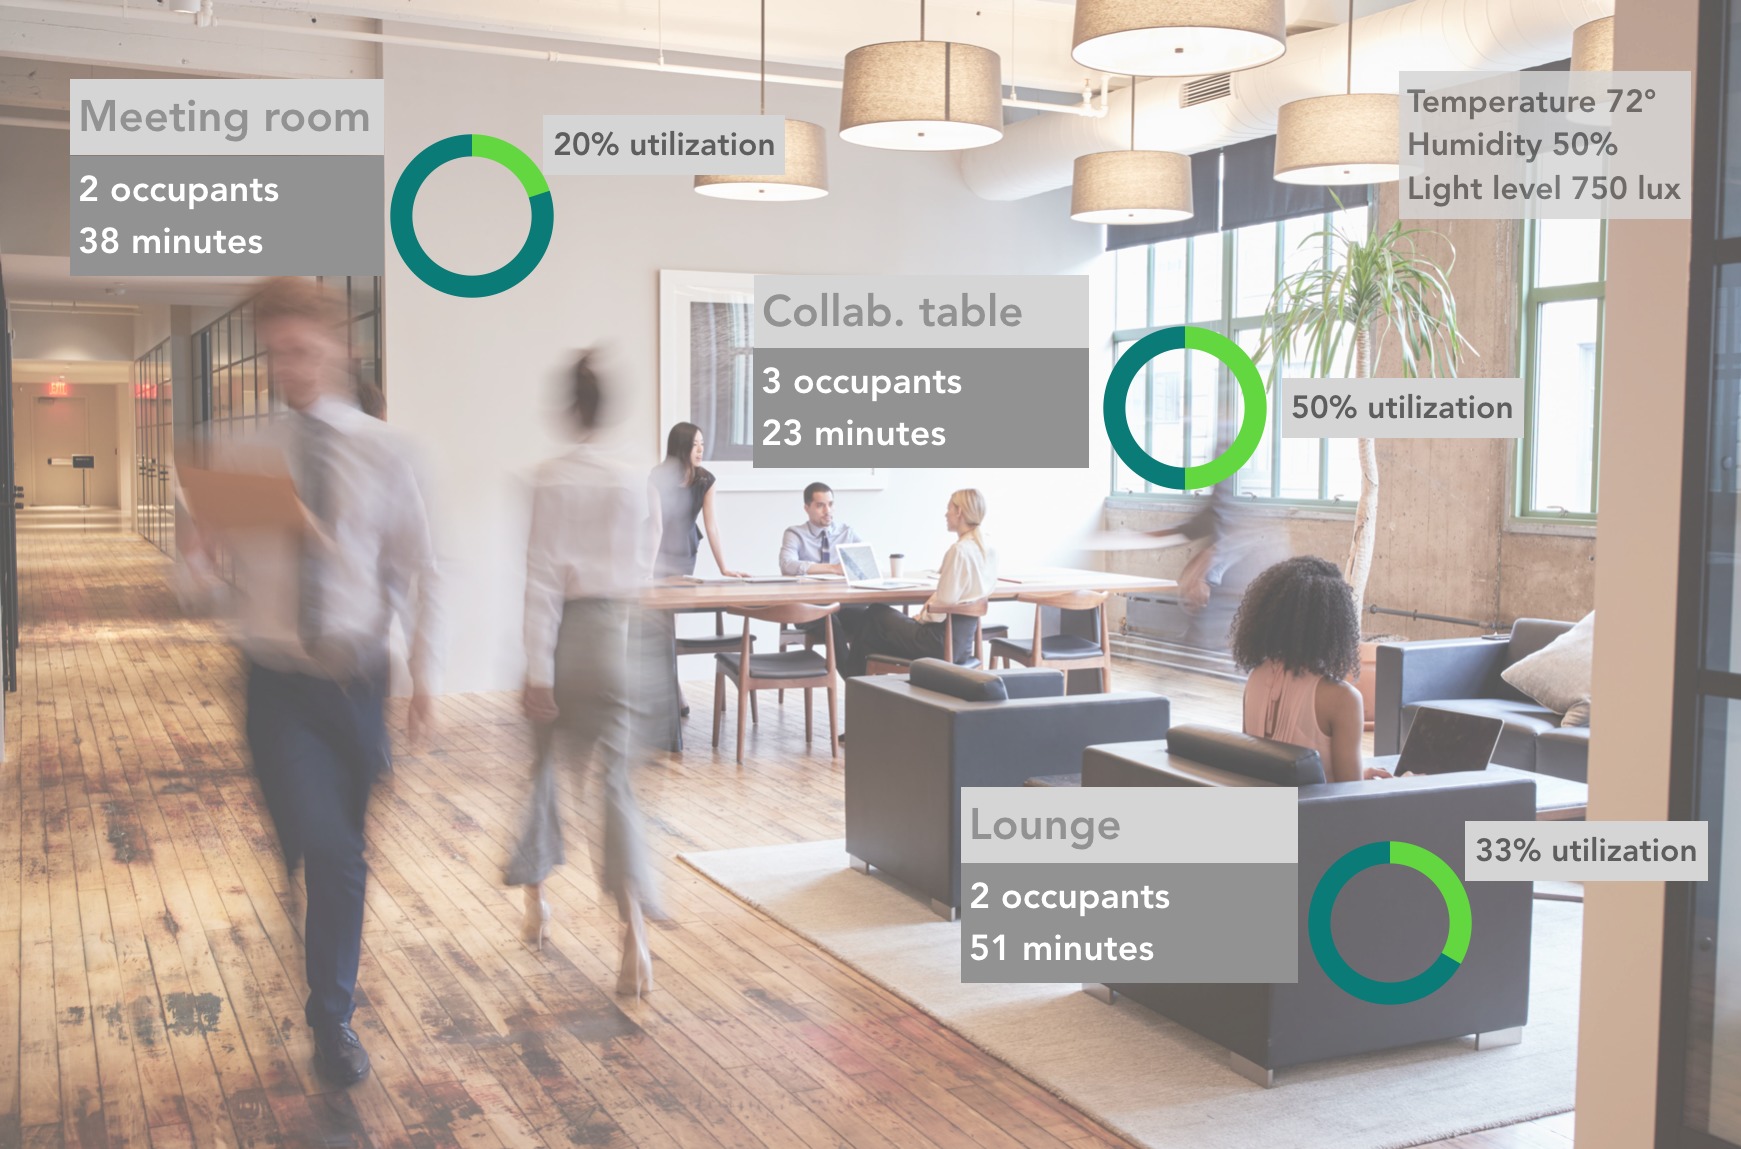
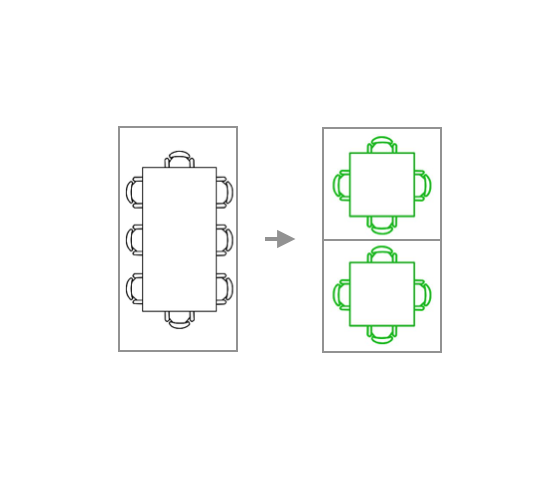
30%-40% of workspaces in a typical office are underutilized1, and the global average utilization of meeting rooms is just 30%2. Determine how efficiently your space is being used by accessing our APIs and dashboards. Use that information to reconfigure the layout of your floor and allocate an appropriate amount of space to collaboration areas, quiet rooms, and meeting spaces. Quantify the benefits of introducing workspace sharing strategies such as hot-desking and hoteling for your mobile workforce.
Increase engagement and productivity
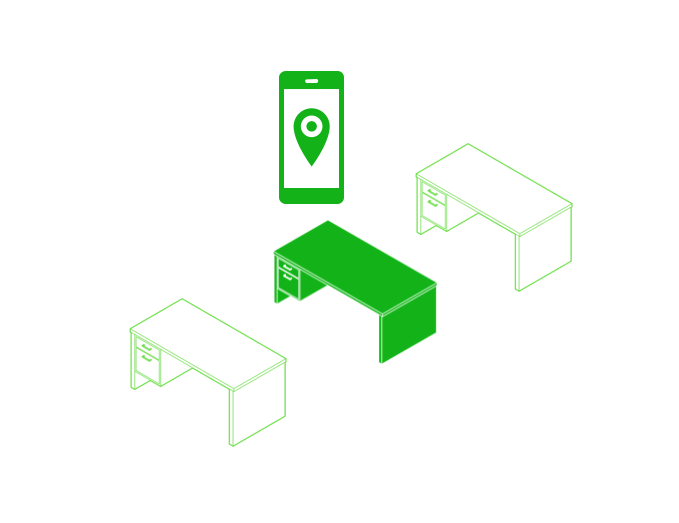
Productivity suffers when employees spend time looking for an available space to meet, work alone, or hold conference calls. Use our real-time occupancy data to automatically release spaces that are booked but not occupied and enable employees to quickly find available spaces that meets their needs -- whether that's a hot desk, a collaboration area, or a conference room. Empower your staff with critical information about their environment to boost their engagement and productivity.
Minimize the energy footprint
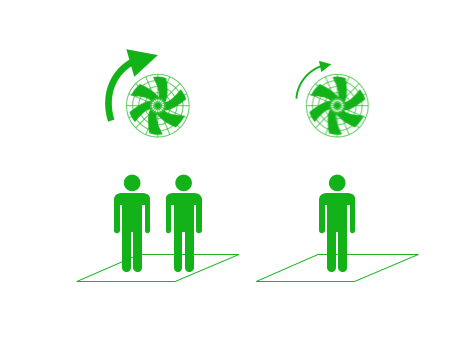
37% of all energy used in commercial buildings is used for heating, cooling, and ventilation (HVAC) and around 30% of it is wasted because accurate occupancy data is unavailable3. Our real-time people counting API can be used to automatically turn down the Variable Air Volume (VAV) ventilation system when there are fewer than the maximum number of occupants in a zone, thus saving energy and reducing operating expenses while providing great air quality for the occupants.
A turn-key solution
The Sembient platform is a complete toolkit for creating an occupant-responsive environment. The solution takes little time to deploy — sensors install in seconds and automatically join the network to begin streaming real-time occupancy data.
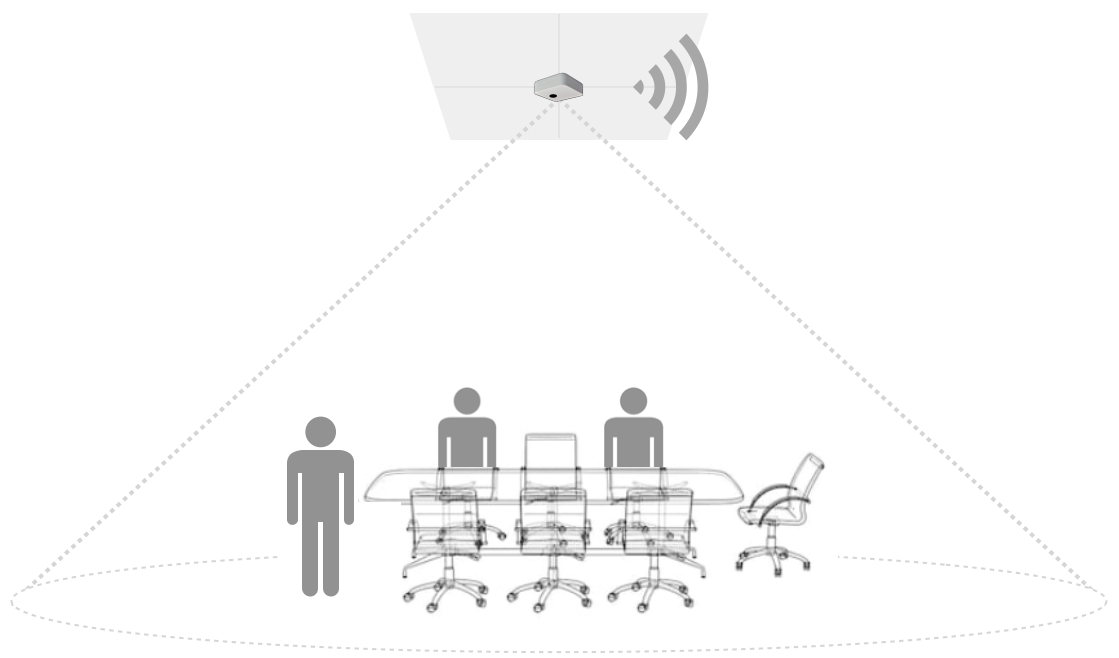
Wireless sensors
Sembient sensors are wireless and easily attach to the ceiling using a magnet. The sensors detect the locations and counts of people in real time. Privacy protection is built into the hardware so that no Personally Identifiable Information (PII) can ever be collected. The sensors operate independently of, and do not interfere with, enterprise wireless networks. Power for the sensors is provided either by internal batteries or an optional external power source, including PoE. Local temperature, humidity, and ambient light levels are also measured and frequently reported.
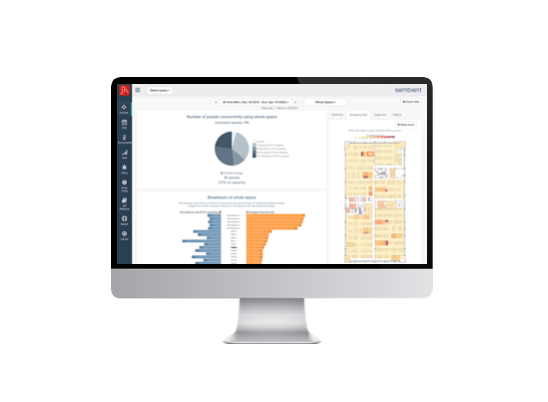
Dashboards
Web dashboards visualize occupancy analytics within the entire building which may include meeting rooms, common areas, and workstation desks pods in offices; and within aisles, near product shelves, and in check-out lanes in the case of retail stores. Occupant density levels and space utilization for specific areas can be obtained over user-defined time intervals, down to the minute. Historical trends can be visualized and occupancy comparisons can be made over different date/time ranges. Data can be exported from the dashboard to csv/xls files.
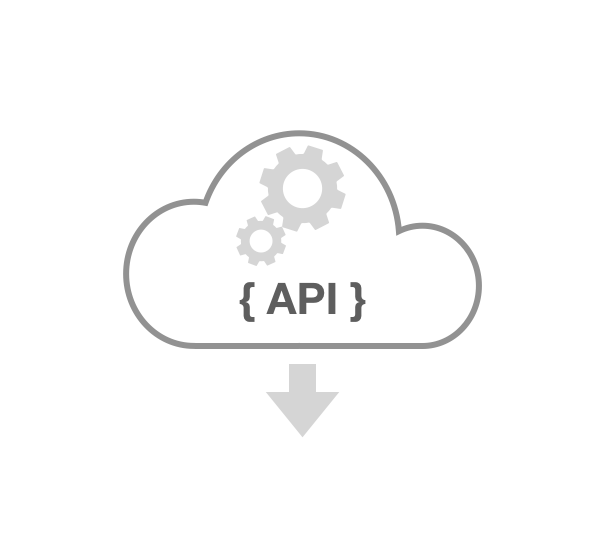
Data integrations
REST APIs and webhooks deliver analytics and real-time occupancy data to third-party applications, including IWMS platforms, room scheduling and booking systems, mapping and localization platforms, desk-finding apps, and enterprise productivity applications such as Slack and MS Teams. Real-time occupancy data can also be used to drive closed-loop control of building automation systems, including occupancy-based control of ventilation fan speeds, blinds and shades, audio-visual/teleconferencing equipment, and lighting systems.
Creating a smarter retail store
Understand the effectiveness of store layout and product mix by measuring the level of engagement your guests have with different sections of the aisle, the end-caps, and the product shelves. Create a more engaging shopping experience for your guests by tuning the store layout and product mix and by deploying contextually relevant and timely customer service precisely when and where it is needed in the store.
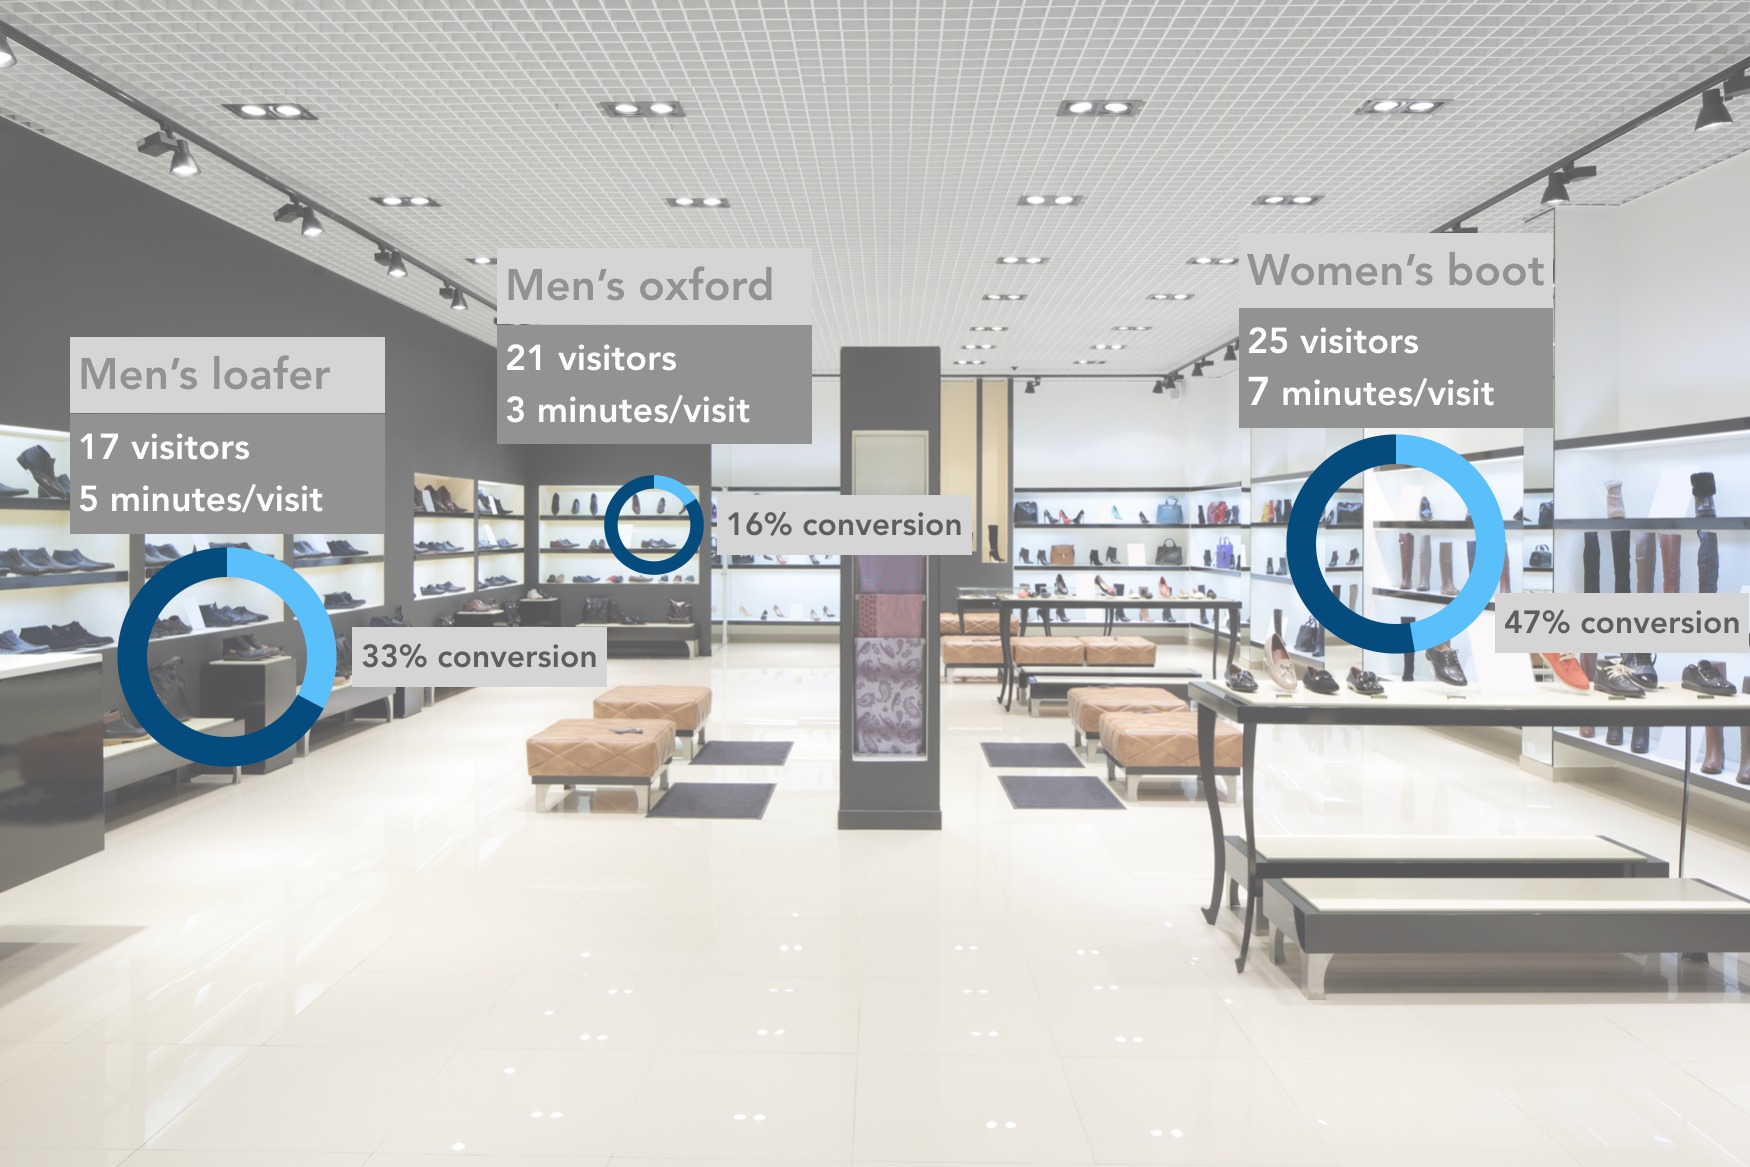

Measure impressions and conversion
A people counter on the door of your store may help measure your store's overall sales efficiency, but do you know the conversion rate for each product in your store? Use the data from our platform to determine how many people looked at a particular shelf but did not purchase products from it. Then, leverage that information to optimize the mix and locations of products on store end-caps and aisle shelves.

Dynamically allocate resources
In-store customer service can be bit tricky if you don't know where your customers are. Automatically send mobile alerts to increase sales staff numbers in areas of the store where there is a lot of customer activity. Use our APIs to generate alerts and open new check-out lanes before wait times become too long.

Optimize store layout
Use foot traffic patterns and dwell times to precisely measure guest engagmenent levels and assess the effectiveness of your in-store marketing campaigns, shelf arrangements, and store layout. Leverage the insights from A/B testing across your store portfolio to come up with optimal strategies that enhance your guest's shopping experience.
